 BMI 18
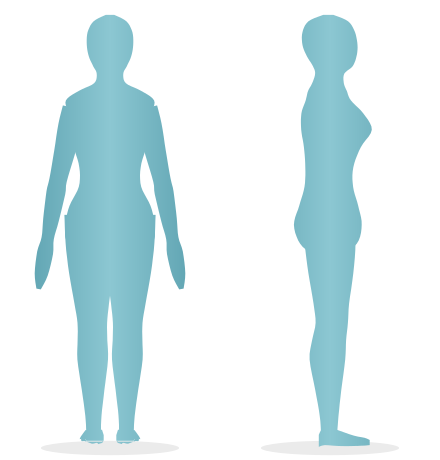 BMI 19
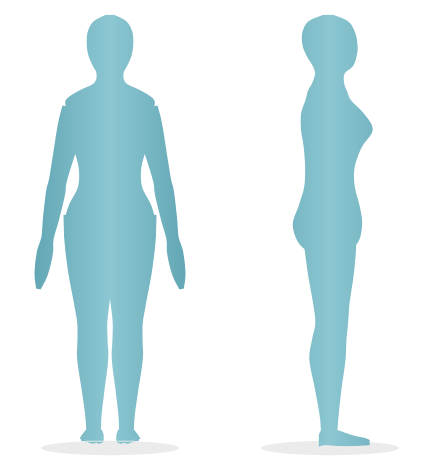 BMI 20
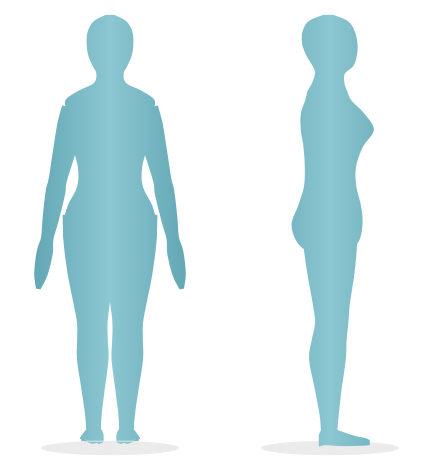 BMI 21
 BMI 22
 BMI 23
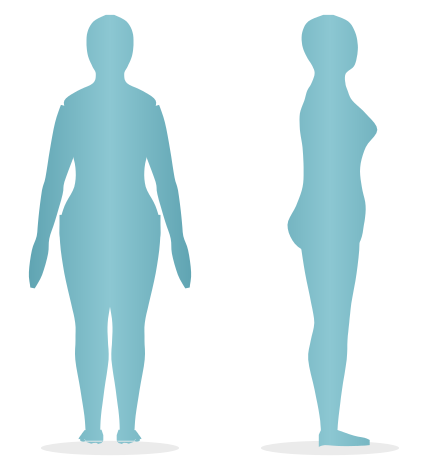 BMI 24
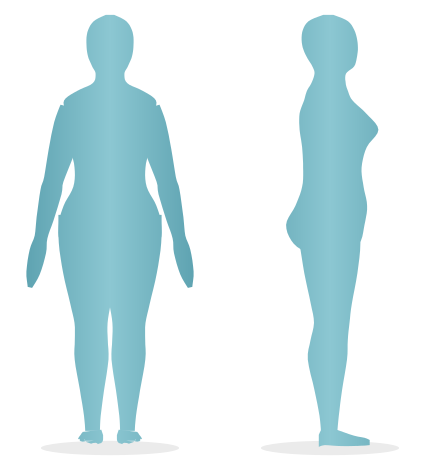 BMI 25
 BMI 26
 BMI 27
 BMI 28
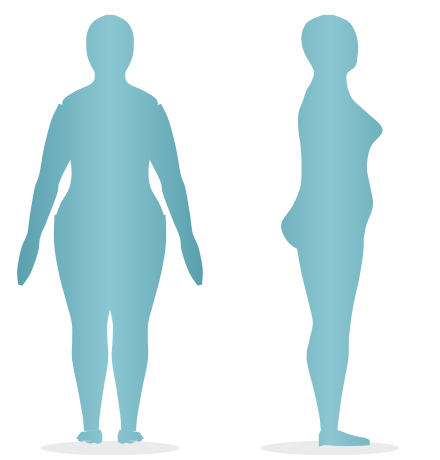 BMI 29
 BMI 30
 BMI 31
 BMI 32
 BMI 33
 BMI 34
 BMI 35
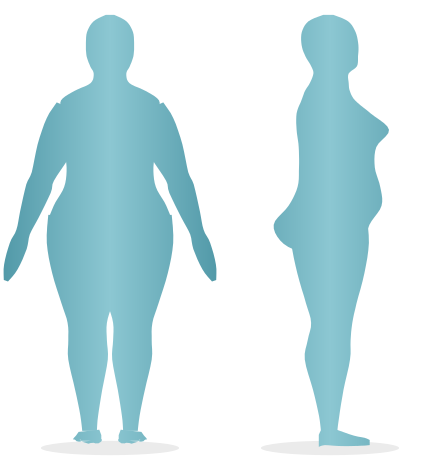 BMI 36
 BMI 37
 BMI 38
 BMI 39
 BMI 40
BMI weight table for women at 163 cm
| BMI | kg | Stone | Pounds | Category |
|---|---|---|---|---|
| BMI 18 | 47.8 kg | 7 st 7 lb | 105 lb | Underweight |
| BMI 19 | 50.5 kg | 7 st 13 lb | 111 lb | Healthy weight |
| BMI 20 | 53.1 kg | 8 st 5 lb | 117 lb | Healthy weight |
| BMI 21 | 55.8 kg | 8 st 11 lb | 123 lb | Healthy weight |
| BMI 22 | 58.5 kg | 9 st 3 lb | 129 lb | Healthy weight |
| BMI 23 | 61.1 kg | 9 st 9 lb | 135 lb | Healthy weight |
| BMI 24 | 63.8 kg | 10 st 1 lb | 141 lb | Healthy weight |
| BMI 25 | 66.4 kg | 10 st 6 lb | 146 lb | Overweight |
| BMI 26 | 69.1 kg | 10 st 12 lb | 152 lb | Overweight |
| BMI 27 | 71.7 kg | 11 st 4 lb | 158 lb | Overweight |
| BMI 28 | 74.4 kg | 11 st 10 lb | 164 lb | Overweight |
| BMI 29 | 77.1 kg | 12 st 2 lb | 170 lb | Overweight |
| BMI 30 | 79.7 kg | 12 st 8 lb | 176 lb | Obese (class 1) |
| BMI 31 | 82.4 kg | 13 st 0 lb | 182 lb | Obese (class 1) |
| BMI 32 | 85.0 kg | 13 st 5 lb | 187 lb | Obese (class 1) |
| BMI 33 | 87.7 kg | 13 st 11 lb | 193 lb | Obese (class 1) |
| BMI 34 | 90.3 kg | 14 st 3 lb | 199 lb | Obese (class 1) |
| BMI 35 | 93.0 kg | 14 st 9 lb | 205 lb | Obese (class 2) |
| BMI 36 | 95.6 kg | 15 st 1 lb | 211 lb | Obese (class 2) |
| BMI 37 | 98.3 kg | 15 st 7 lb | 217 lb | Obese (class 2) |
| BMI 38 | 101.0 kg | 15 st 13 lb | 223 lb | Obese (class 2) |
| BMI 39 | 103.6 kg | 16 st 4 lb | 228 lb | Obese (class 2) |
| BMI 40 | 106.3 kg | 16 st 10 lb | 234 lb | Obese (class 3) |
BMI and women’s bodies
At the same BMI, women usually carry more body fat than men — typically around 8 to 10 percentage points more — because of differences in hormones and muscle mass. Women also tend to store fat on the hips, thighs and bottom (a “pear” pattern), while men store more around the waist. The female model reflects this: as BMI rises it widens at the hips and thighs more than the male model does, and the waist fills in later.
After the menopause, falling oestrogen shifts more fat storage to the waist. That is why waist measurement becomes especially useful for women in midlife: a waist of more than half your height points to higher health risk, even at a healthy BMI.
Pregnancy and BMI
Adult BMI categories do not apply during pregnancy. Your midwife will usually record your BMI at your booking appointment, based on your weight early in pregnancy, to plan your care. If you are planning a pregnancy, a BMI in the healthy range lowers the risk of complications such as gestational diabetes and pre-eclampsia.
Visual BMI 20 female
BMI 20 is one of the most searched BMIs for women. At 163 cm it means 53.1 kg (8 st 5 lb): a slim figure with a defined waist, low in the healthy range. See the visual BMI 20 female page for front and side images and weights for every height.
BMI categories
May mean too little energy or nutrition.
Lowest average risk of weight-related illness.
Risk of type 2 diabetes and heart disease starts to rise.
Class 1: 30–34.9 · Class 2: 35–39.9 · Class 3: 40+
NICE advises lower thresholds for adults of South Asian, Chinese, other Asian, Middle Eastern, Black African or African-Caribbean family background: overweight from BMI 23 and obesity from 27.5, because health risks rise at lower BMIs. Tick the box in the calculator to use them.
Sources
The body shapes on this site are illustrations generated from height, weight and sex. They show a typical build and cannot show your own muscle, frame or fat distribution. BMI is a screening measure for adults aged 18 and over; it is not a diagnosis and is not valid during pregnancy. Speak to your GP or a registered dietitian for personal advice. Full disclaimer.